




Table of Contents
Safety Stock for Ecommerce: How Much Inventory Should You Hold in China?
Time: Aug 28,2026 Author: SFC Source: www.sendfromchina.com

- Quantity: How much total buffer does each SKU need?
- Location: Should that buffer sit at the supplier, in a China warehouse, near customers, or across several locations?
- Timing: When should you reorder or rebalance it?
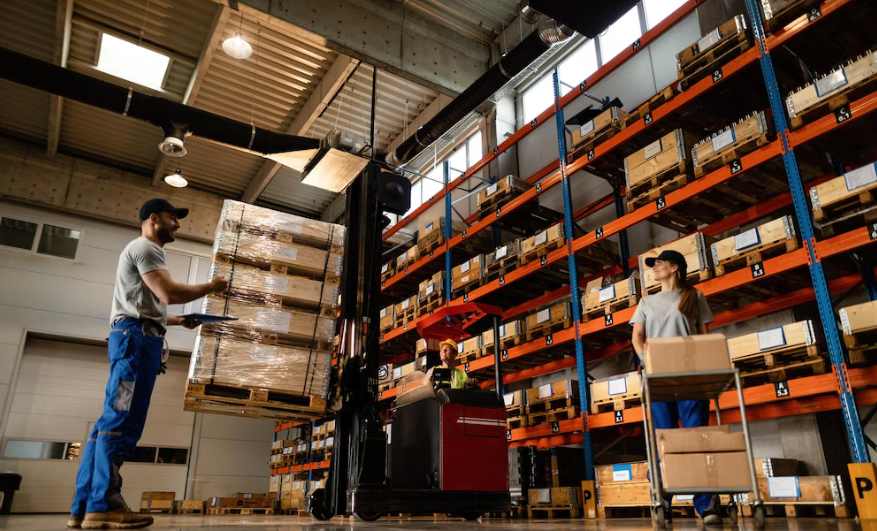
What Safety Stock Is—and What It Is Not
|
Inventory Type
|
Purpose
|
Simple Example
|
|
Cycle stock
|
Covers expected demand between planned replenishments
|
The normal units sold between purchase orders
|
|
Safety stock
|
Covers unexpected demand or delay
|
Extra units kept for a supplier delay
|
|
Pipeline inventory
|
Stock already moving through production or transport
|
Goods on a vessel or in customs
|
|
Seasonal stock
|
Covers a known future demand increase
|
Inventory purchased for a holiday campaign
|
|
Dead or obsolete stock
|
Inventory unlikely to sell normally
|
Old packaging after a product redesign
|
Safety Stock Versus Reorder Point
Reorder point = expected demand during replenishment lead time + safety stock
Reorder point = (20 × 30) + 180 = 780 units
Inventory position = usable on-hand inventory + confirmed inbound inventory − allocated orders − backorders
Why China-Sourced Ecommerce Needs a Different Lead-Time View
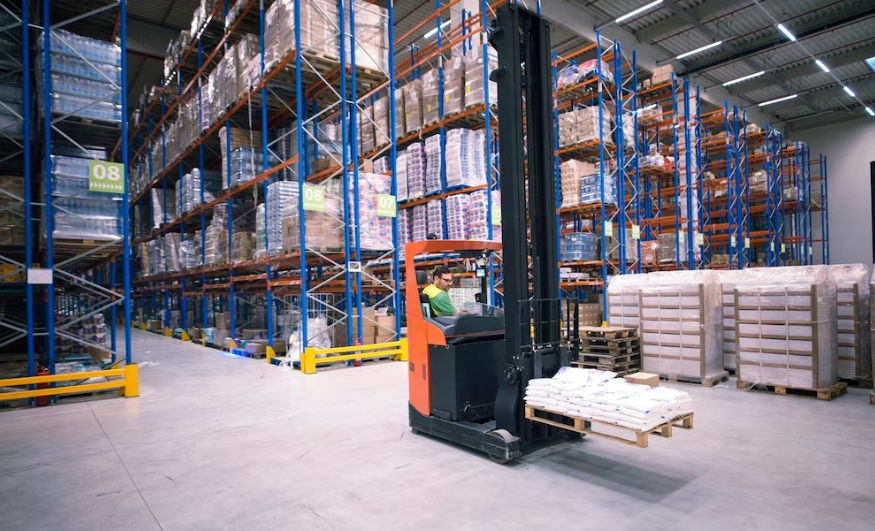
The Four Lead-Time Layers
1. Production Layer
2. Origin Layer
3. Cross-Border Layer
4. Destination Layer
Which Lead Time Belongs in the Formula?
- If you hold finished goods in a China warehouse and replenish directly from the factory, the relevant lead time may end when the China warehouse receives usable stock.
- If you protect inventory in a US warehouse, the lead time may include China production, origin processing, international shipping, customs, and US receiving.
- If you replenish Amazon FBA, include the time until stock becomes available for sale, not merely the carrier-delivery date.
- If you operate a hybrid network, the China buffer and destination buffer protect different risk windows.
Risks Hidden Inside an Average
- component shortages;
- quality rejection and rework;
- missed factory handoffs;
- factory shutdowns;
- warehouse receiving queues;
- missed carrier cutoffs;
- space shortages;
- customs inspection;
- peak congestion;
- destination receiving backlog.
Four Ways to Calculate Ecommerce Safety Stock
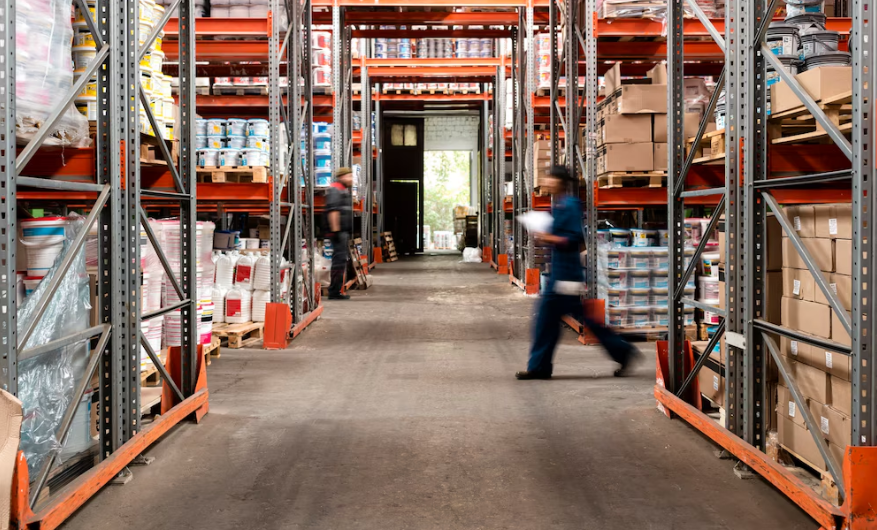
Method 1: Days-of-Cover Buffer for New or Low-Data SKUs
Safety stock = average daily demand × chosen buffer days
Safety stock = 12 × 14 = 168 units
Method 2: Average/Maximum Method
Safety stock = (maximum daily demand × maximum lead time) − (average daily demand × average lead time)
- average daily demand: 20 units;
- maximum daily demand: 28 units;
- average lead time: 30 days;
- maximum lead time: 38 days.
Safety stock = (28 × 38) − (20 × 30) = 1,064 − 600 = 464 units
Method 3: Service-Level Method With Stable Lead Time
Safety stock = z × σd × √L
- z = service factor linked to the target cycle service level;
- σd = standard deviation of demand per period;
- L = replenishment lead time measured in the same periods.
|
Illustrative Cycle Service Level
|
Approximate z-Score
|
|
90%
|
1.28
|
|
95%
|
1.65
|
|
97.5%
|
1.96
|
|
98%
|
2.05
|
|
99%
|
2.33
|
- average demand is 20 units per day;
- daily-demand standard deviation is 6 units;
- replenishment lead time is 30 days;
- target cycle service level is 95%, with an illustrative z-score of 1.65.
Safety stock = 1.65 × 6 × √30Safety stock ≈ 54.2 units, rounded according to the brand’s policy
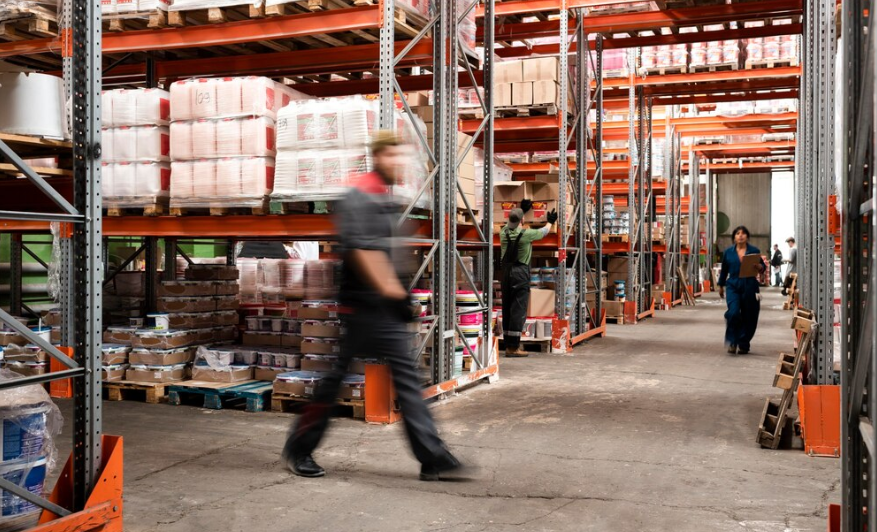
Method 4: Variable Demand and Variable Lead Time
Safety stock = z × √(L × σd² + d² × σL²)
- z = service factor;
- L = average lead time in periods;
- σd = standard deviation of demand per period;
- d = average demand per period;
- σL = standard deviation of lead time in the same periods.
- average daily demand: 20 units;
- daily-demand standard deviation: 6 units;
- average lead time: 30 days;
- lead-time standard deviation: 4 days;
- target cycle service level: 95%, using an illustrative z-score of 1.65.
Safety stock = 1.65 × √(30 × 6² + 20² × 4²)Safety stock = 1.65 × √(1,080 + 6,400)Safety stock ≈ 143 units
Which Formula Should You Use?
|
Situation
|
Recommended Starting Method
|
Main Warning
|
|
New SKU with little history
|
Days-of-cover buffer
|
Review weekly as actual demand develops
|
|
Basic history with useful averages and maximums
|
Average/maximum
|
Investigate extreme outliers
|
|
Stable lead time and variable demand
|
Service-level model
|
Demand periods must match lead-time units
|
|
Variable demand and variable lead time
|
Combined-variability model
|
Requires clean demand and lead-time data
|
|
Highly seasonal SKU
|
Forecast event demand first, then model uncertainty
|
Do not treat expected seasonal uplift as safety stock
|
|
Intermittent spare part
|
Cost-and-service policy plus specialized forecasting
|
Normal distribution may fit poorly
|

A Worked Example: How Much Inventory Should You Hold in China?
- average daily demand: 40 units;
- daily-demand standard deviation: 10 units;
- average factory-to-China-warehouse lead time: 18 days;
- lead-time standard deviation: 3 days;
- target cycle service level: 95%;
- illustrative z-score: 1.65.
Safety stock = 1.65 × √(18 × 10² + 40² × 3²)Safety stock = 1.65 × √(1,800 + 14,400)Safety stock = 1.65 × √16,200Safety stock ≈ 210 units
40 × 18 = 720 units
720 + 210 = 930 units
- calculate the local buffer using US demand and China-to-US replenishment variability;
- subtract confirmed pipeline inventory correctly;
- avoid duplicating the same upstream risk at every node;
- decide which location handles customer-service risk and which protects supply risk.
Where Should the Safety Stock Sit?
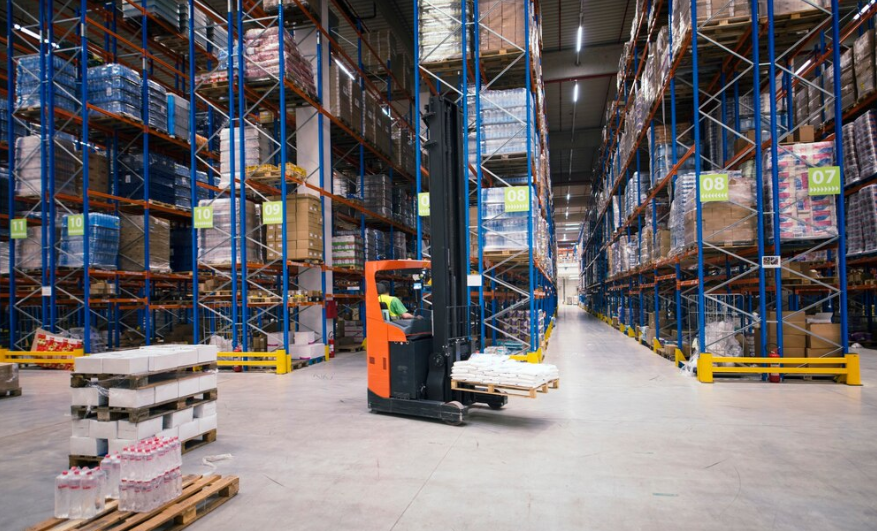
Option 1: At the Supplier
- lower warehouse handling before release;
- fast response to a production order;
- components or finished goods remain close to the factory;
- less capital tied up in downstream locations if the supplier owns the stock.
- the stock may be allocated to another customer;
- inventory visibility may be weak;
- quality has not been independently confirmed;
- labels or packaging may not be fulfillment-ready;
- commercial ownership may be unclear;
- one supplier cannot consolidate products from other factories.
Option 2: In a China Warehouse
- inventory from several suppliers;
- receiving and quantity checks;
- quality inspection or exception handling;
- kitting and bundle assembly;
- export-ready packaging;
- direct international order fulfillment;
- replenishment to destination warehouses;
- flexible carrier selection.

Option 3: In a Destination-Country Warehouse
- stable fast movers;
- concentrated demand;
- marketplace replenishment;
- products with strict delivery promises;
- replacement items that customers need quickly.
Option 4: Split Stock Across China and Destination Markets
|
Location Model
|
Best Fit
|
Main Advantage
|
Main Risk
|
KPI to Watch
|
|
Supplier stock
|
Reliable supplier and simple product
|
Close to production
|
Weak control or allocation risk
|
Confirmed release time
|
|
China warehouse
|
Multiple suppliers and global demand
|
Flexible pooled inventory
|
Cross-border transit remains
|
Origin inventory accuracy
|
|
Destination warehouse
|
Concentrated demand and fast delivery
|
Short customer lead time
|
Local overstock
|
Local days of cover
|
|
Hybrid network
|
Stable core demand plus global long tail
|
Separates supply and service buffers
|
More planning complexity
|
Total network stock and fill rate
|
How Cost Changes the Right Safety Stock

Stockout Cost Can Include More Than Lost Revenue
- lost contribution margin;
- canceled orders;
- marketplace ranking or availability damage;
- paused advertising efficiency;
- emergency air freight;
- customer-support work;
- substitute or replacement shipping;
- lost repeat purchases;
- wholesale penalties or backorders.
Carrying Cost Is More Than Storage Rent
- storage fees;
- capital tied up in inventory;
- insurance;
- damage and shrinkage;
- counting and handling;
- expiry or product aging;
- markdowns;
- obsolescence;
- disposal;
- transfer or return costs.
A Practical Cost Test
Hold another unit when the expected stockout cost it avoids is greater than the expected carrying and obsolescence cost of that unit.
Storage Density Changes the Economics
- pallet, bin, shelf, or cubic-meter billing;
- packed dimensions, not only product dimensions;
- case packs and master cartons;
- stackability;
- fragile or climate-sensitive storage;
- slow-moving and long-term-storage fees.
Safety Stock by SKU Type and Growth Stage
|
SKU Type
|
Suggested Planning Approach
|
Reason
|
|
Stable fast mover
|
Statistical formula with a defined service level
|
Clean history and high stockout exposure
|
|
Volatile promotional SKU
|
Event forecast plus temporary buffer
|
Normal history understates event demand
|
|
New product
|
Analog SKU, preorder data, and staged buffer
|
Little direct history exists
|
|
Seasonal product
|
Seasonal forecast plus uncertainty
|
Known uplift is not safety stock
|
|
Slow mover
|
Cost-based minimum or low service target
|
Excess stock may cost more than a stockout
|
|
High-margin spare part
|
Higher service target where holding cost is low
|
Customer downtime makes shortages expensive
|
|
Expiry-sensitive cosmetic
|
Shelf-life and lot-aware cap
|
Overstock may expire before sale
|
|
Bulky low-margin item
|
Small buffer or make-to-order alternative
|
Storage and shipping are expensive
|
|
Bundle component
|
Shared-component planning
|
One missing component blocks several products
|
|
Marketplace bestseller
|
Channel-aware buffer and replenishment trigger
|
Stockout can hurt listing performance
|
- Value: Which SKUs contribute the most revenue or margin?
- Variability: Which have stable versus unpredictable demand?
- Risk: Which are hard to replenish or expensive to stock out?

How MOQ, Production Batches, and Supplier Reliability Affect the Buffer
- promised versus actual production time;
- on-time delivery;
- quantity accuracy;
- defect and rejection rate;
- rework time;
- component availability;
- response during peaks;
- release flexibility;
- emergency capacity.
Seasonality, Promotions, and Product Launches
Do Not Put Known Demand Into the Buffer
- historical event uplift;
- current audience size;
- traffic and conversion assumptions;
- preorder or waitlist data;
- channel commitments;
- advertising plan;
- inventory already committed to other markets.
Use the Current Factory and Logistics Calendar
New Products Without Sales History
- sales from analogous products;
- preorder or crowdfunding data;
- paid-media traffic assumptions;
- retailer or marketplace commitments;
- staged production;
- smaller early replenishments where feasible;
- frequent review after launch.
Recalculate and Rebalance Safety Stock
Use a Review Cadence That Fits the SKU
- Weekly: launches, volatile bestsellers, stockout-prone products, and high-value promotional SKUs.
- Monthly: active core products with meaningful sales history.
- Quarterly: stable, low-risk products with long life cycles.
- Event-based: after a supplier change, route change, price change, packaging redesign, channel launch, MOQ change, or major forecast update.
Monitor the Inputs and the Result
- forecast error;
- demand standard deviation;
- average and variable supplier lead time;
- stockout frequency;
- cycle service level;
- fill rate;
- days of cover;
- inventory turnover;
- emergency freight spend;
- aging and obsolete inventory;
- storage cost by SKU;
- inventory accuracy;
- inbound and pipeline inventory.
Rebalance Between China and Destination Warehouses
- regional sales velocity;
- contribution margin;
- stock age;
- local stockout risk;
- China-to-destination lead time;
- parcel and freight cost;
- marketplace availability requirements;
- product restrictions;
- return and transfer cost.
Common Safety-Stock Mistakes
|
Mistake
|
What Happens
|
Better Approach
|
|
Use one buffer percentage for every SKU
|
Bulky slow movers and small bestsellers receive the same policy
|
Segment by value, variability, cost, and replenishment risk
|
|
Use average lead time only
|
Delays disappear from the model
|
Measure lead-time variation as well as the average
|
|
Treat a known promotion as uncertainty
|
Event demand is counted twice
|
Forecast the event, then buffer the remaining error
|
|
Ignore inventory in transit
|
Duplicate purchase orders create overstock
|
Use inventory position, not on-hand stock alone
|
|
Treat MOQ as safety stock
|
Large production batches look like risk control
|
Separate cycle stock from the buffer calculation
|
|
Duplicate a full buffer at every warehouse
|
Network inventory grows much faster than demand
|
Define which risk each node protects
|
|
Count damaged or quarantined units as available
|
The system shows protection that cannot fulfill orders
|
Use usable inventory status
|
|
Never reduce the buffer after demand slows
|
Aging stock and storage cost increase
|
Recalculate on a defined cadence
|
|
Use observed sales during stockouts
|
Demand appears lower because the product was unavailable
|
Correct for stockout-censored demand where possible
|
|
Target 99% service for every product
|
Low-margin slow stock absorbs cash
|
Set service targets by economics and customer impact
|
A 30-Day Safety-Stock Setup Plan

Week 1: Clean the Data
Week 2: Segment SKUs and Select Methods
- a calculation method;
- target cycle service level or business policy;
- review cadence;
- minimum and maximum practical buffer;
- exception owner.
Week 3: Calculate Quantity and Location
- upstream China buffer;
- local customer-facing buffer;
- pipeline stock;
- reorder and transfer trigger;
- planned replenishment service;
- emergency route.
Week 4: Put Triggers Into the Workflow
- current inventory position;
- safety-stock target;
- reorder point;
- confirmed inbound;
- days of cover;
- supplier lead-time status;
- forecast error;
- aged inventory;
- stockout and emergency-freight events.
Safety Stock Checklist for Inventory Held in China
- Demand history is clean and segmented by SKU and channel.
- Stockout periods are identified so sales do not understate demand.
- Promotions and known seasonal uplift are forecast separately.
- Supplier-production lead time has clear start and end points.
- Origin warehouse, export, transit, customs, and destination time are measured separately.
- The calculation method matches data quality.
- The target service level reflects margin and customer impact.
- MOQ and cycle stock are separated from safety stock.
- Confirmed pipeline inventory is included in inventory position.
- Damaged, quarantined, and reserved units are excluded from usable stock.
- Storage density, capital cost, shelf life, and obsolescence are considered.
- China and destination buffers protect defined risks.
- The reorder point and purchase quantity are separate decisions.
- Review cadence and exception ownership are documented.
- Results are checked after supplier, route, product, or demand changes.
Conclusion
FAQs
1. What is safety stock in ecommerce?
2. How do you calculate safety stock for ecommerce inventory?
3. How many days of safety stock should an ecommerce brand hold?
4. What service level should I use for safety stock?
5. Should safety stock be stored in China or near customers?
6. How does supplier lead time affect safety stock?
7. Is MOQ the same as safety stock?
8. How often should ecommerce safety stock be recalculated?
9. How do you calculate safety stock for a new product with no sales history?
10. Can a China 3PL help reduce total safety stock?
 Post Views:1087
 TAGS:
TAGS:
Copyright statement: The copyright of this article belongs to the original author. Please indicate the source for reprinting.
Previous Post
How to Ship Thermal Grease Internationally
Next Post
China Fulfillment RFP Template: 35 Questions to Compare 3PL Quotes
TAGS
Hot Research
Recent News
Get a Custom China Fulfillment Solution with FREE Storage for 30 Days
Want to know about our services, fees or receive a custom quote?
 Want to know about our services, fees or receive a custom quote?
Please fill out the form on the right and we will get back to you within a business day.
The more information you provide, the better our initial response will be.